Copyright
©2013 Owlstone Ltd. All rights reserved. Owlstone Ltd provides this case study to its customers on demand as an example of the method development cycle. This case study is copyright protected and no part of this publication may be reproduced, transmitted, transcribed, stored in a retrieval system or translated into any language or computer language, in any form or by any means, without the prior written permission of Owlstone Ltd.
The Owlstone logo, Owlstone® and Lonestar® are registered trademarks of Owlstone Nanotech, Inc.
Swagelok® is a registered trademark of Swagelok Company.
Microsoft® and Windows® are registered trademarks of the Microsoft Corporation and the embedded Windows software must be used in accordance with Microsoft’s terms and conditions (see www.microsoft.com)
Disclaimer
Owlstone Ltd makes no representations or warranties, either expressed or implied, with respect to the contents hereof and specifically disclaims any warranties, merchantability or fitness for any particular purpose. Furthermore, Owlstone Ltd reserves the right to revise this publication and to make changes from time to time in the contents hereof without obligation of Owlstone Ltd to notify any person of such revision or changes.
Notice of Proper Use of Owlstone Ltd Instruments
The supplied system is in compliance with international regulations. If this system is used in a manner not specified by Owlstone Ltd, the protection provided by the system could be impaired.
Contacting Owlstone
Visit the Owlstone website (www.owlstonenanotech.com) for up to date contact details and service support:
For general inquires please email info@owlstonenanotech.com
|
UK Office Owlstone Ltd 127 Cambridge Science Park, Milton Road, Cambridge CB4 0GD UK Tel: +44 (0)1223 428 200 Fax: +44 (0)1223 428 201
|
US Office OWLSTONE Nanotech Inc 761 Main Avenue Norwalk, CT 06851 USA Tel: +1 203-908-4848 Fax: +1 203-908-4849 |
Harmful Substances

Check chemical compatibility: materials in the flow path include PTFE, stainless steel, aluminium, silicon, graphite, circuit board and Viton®. Ensure test atmospheres are neither corrosive nor reactive with materials in the flow path and can be safely operated at 60°C. If in doubt, please contact an Owlstone representative using the contact details provided.
Note that the relative humidity sensors are for indication only. Typically the humidity sensors are accurate to +/-5%, but they can be affected by the exact makeup of the process sample and can be easily altered or damaged by certain chemicals.
Radioactive Material – Lonestar Systems Only
Please consult local regulations about your responsibility in regards to the source. For instance in England and Wales this will be compliance with “the radioactive substance (testing instruments) (England and Wales) exemption order 2006” and “the ionising radiation regulations 1999”.
For the US the Lonestar® system is manufactured in compliance with U.S. NRC safety criteria in 10 CFR 32.27 so the purchaser is exempt from any regulatory requirements.
For transport purposes the Lonestar® system complies to UN2911 standards for radioactive sources, and is provided with an identification certificate.
Introduction
It is important to have a structured approach to method development, whatever the piece of equipment is to be used for the method. The Lonestar® is no different from this, although the parameters that are important to the Lonestar® may well be different to other equipment.
This procedure is intended to be used as a source of information as to a typical method development cycle such as would be performed in the Owlstone Development Laboratory in Cambridge. This only covers the experimental procedures required to successfully develop a method. The software configuration for the method to be used in Analyser Mode or to quantitate data is not covered in this procedure. If training is required in the Lonestar® software, Owlstone runs regular training programs in its Cambridge office. Alternatively, the presentation and training data can be found on the Owlstone website by following the following link: http://owlstone.zendesk.com/forums/101890-Training-and-Tutorials
The Owlstone website has several documents, including training material, which details the software and hardware.
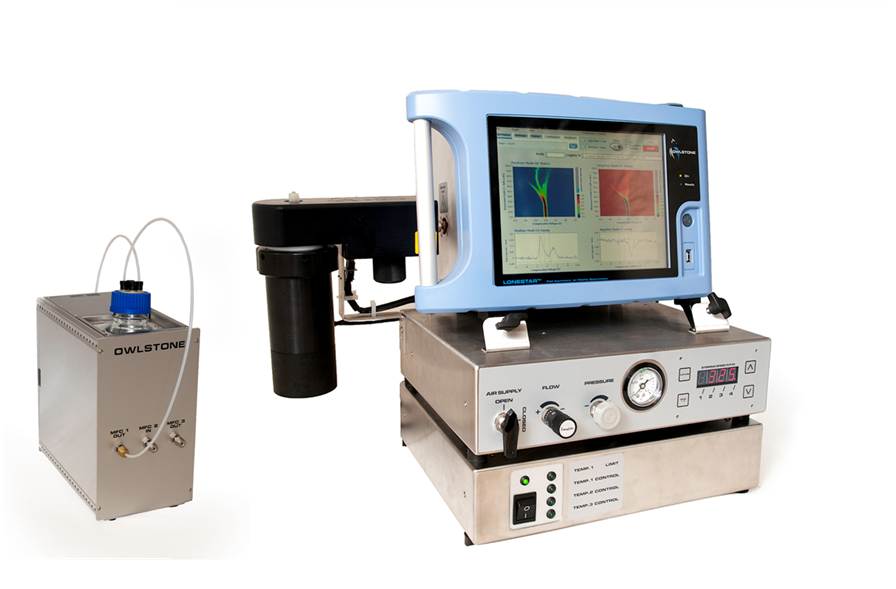
A labelled diagram of the Lonestar® and associated hardware can be found in Figure 6
Literature Search
Before commencing experimental work to develop a method, performing a literature search is an important step as this will give several clues as to how you can expect of your analyte to behave in the Lonestar® and whether the desired limit of detection (LOD) is likely to be achieved.
Table 1 details the parameters sought from a literature search that impact upon the method development process. The following link is useful for sourcing the gas phase ion energetics data (proton/electron/first ionisation energy), Wikipedia and the analyte’s MSDS can also be used for information: http://webbook.nist.gov/chemistry/name-ser.html.
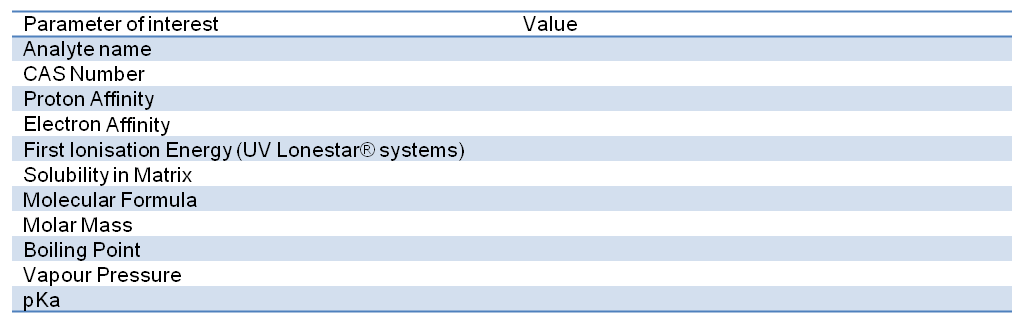
Table 1 Parameters important to determine from a literature search
If an analyte has only a Proton Affinity listed, it is likely to be detected solely in Positive Mode by the Lonestar®. Similarly, if an analyte has only an electron affinity listed, it is likely to be detected solely in Negative Mode by the Lonestar®. Certain analytes may be detected in both Positive and Negative Mode depending upon the conditions within the Lonestar®. This information may well not be discovered during a literature search. If a UV-Lonestar® is being used, then the first ionisation energy is important to know as this will suggest which UV-bulb is required to be installed.
The analyte solubility within the sample matrix has a big impact on the method development. If the analyte is highly soluble, then sample preparation steps must be taken to liberate the analyte into the headspace. Similarly, if the analyte is immiscible in the matrix, but suspended as an emulsion, then stirring is likely to be required as analytes can only be liberated into the headspace at the surface of the sample matrix.
The headspace above solid materials can also be analysed, but care must be taken if the sample matrix is a fine powder to ensure that the powder is kept within the sample bottle and does not enter and contaminate the Lonestar®.
The molecular formula, structure and molar mass give an indication as to how mobile the analyte is likely to be under the electric fields used within the Lonestar® chip. Large, heavy analytes are likely to have low mobilities, hence are likely to have low values for the Compensation Voltage at any given Dispersion Field. Light, small analytes are likely to have larger high-field mobilities, hence are likely to have a more negative Compensation Voltage than a larger molecule at the same Dispersion Field.
The boiling point and vapour pressure give an idea as to how important heating the sample will be in liberating sufficient analyte into the headspace for detection.
The pKa is used to suggest whether pH optimisation may be required, depending upon the matrix. A basic analyte is more likely to partition into the headspace in a basic background matrix rather than an acidic matrix.
The absolute Lonestar® sensitivity towards an analyte is fixed under any given set of conditions. The total flow rate may be increased to improve sensitivity, at the cost of analyte resolution, so the sample preparation steps are the most important to optimise as these are what are most likely determine if a method is successful or not. This is to be expected, and is the same for any headspace method development.
If the components within the background matrix are known, a useful tool is available on the Owlstone website (http://www.owlstonenanotech.com/faims/nickel-affinity-video ). This allows you to enter the analyte and background components to determine the effect of the matrix upon the Lonestar® sensitivity towards your analyte. If your background matrix has a very high concentration of a component with a high proton affinity, it is unlikely that you will be able to detect a low concentration of an analyte with a low proton affinity. In this case, the use of a UV-Lonestar® may be required if the ionisation energy of the analyte is favourable.
Parameters Requiring Consideration
It is important to determine the effect of pressure and humidity upon both the analyte and matrix components. Pressure and humidity have significant effect upon the high-field mobility of analytes, thus the resolution between the analyte of interest and the background matrix.
If available, an Owlstone OVG vapour generator is useful for testing the effect of humidity and pressure on a steadily delivered concentration of analyte in the vapour phase. A permeation tube is constructed for the pure analyte, which is incubated at a defined temperature. Once the permeation rate has equilibrated, a known concentration of analyte can be delivered to the Lonestar® system for analysis. As the concentration delivered remains constant under fixed conditions, the effect of humidity and pressure can be directly compared. As the concentration of the vapour is known, this flow may be further diluted so the absolute vapour LOD can be determined.
If an Owlstone OVG is not available, then an aqueous sample is prepared and used for this study. Table 2 summarises starting conditions typically used at the beginning of method development. The resultant humidity should remain constant between samples, though the humidity can be affected by sample temperature or the addition of salts, if required.
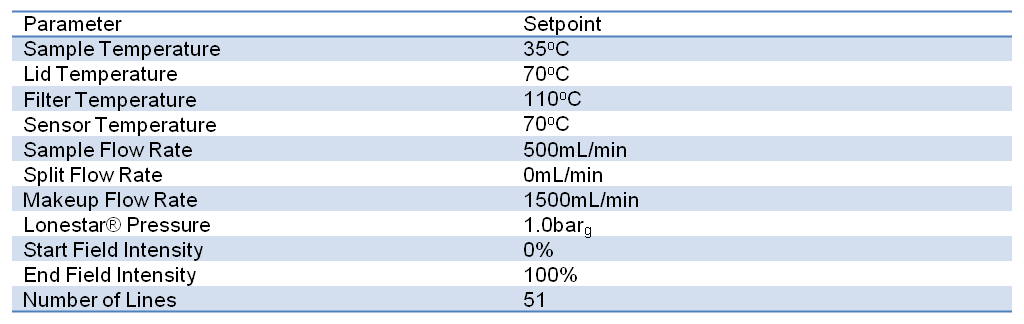
Table 2 Starting Lonestar® parameters for method development
Using these conditions, an aqueous standard is analysed to detect the analyte. It is worth analysing this sample for 30 minutes to begin with as this allows you to determine the time required for the maximum release of analyte into the headspace and also how rapidly the sample is depleted of analyte under these conditions.
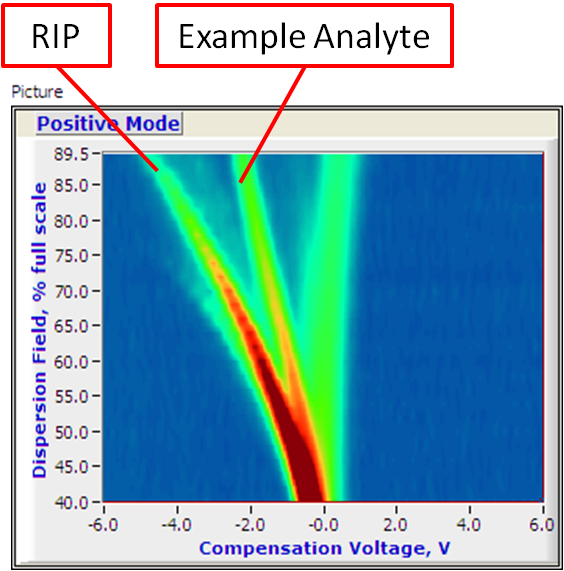
Figure 1 A standard containing an example analyte analysed under initial conditions

Figure 2 Plot of Ion Current Response for an example analyte over time
From the plot above, we can determine the optimal time window for stable quantitative analysis (circled in red 0 for stable quantitative analysis). It is important to compare analyses for the same time window so that correct judgement regarding the effects seen can be determined. It is also important to repeat all samples in triplicate to ensure that you are able to draw firm conclusions from what you see from the data. If the data is not reproducible, it is impossible to draw any conclusions from the data as what you are seeing may be a genuine effect or is simply sample variation.
Pressure:
Once the analyte has been detected reproducibly, the effect of pressure can be evaluated. It is important to study the effect of pressure, not only upon the analyte but on the background matrix also. The requirement is to determine a pressure where sufficient resolution is seen between the analyte of interest and background matrix components.
As the sample preparation steps have not yet been determined, it may be necessary to work at analyte concentrations above the desired range for detection.
Lowering the pressure has an effect similar to moving the Dispersion Field Matrix downwards, i.e. the RIP will begin to curve at a lower Dispersion Field %. Working at lower pressure typically improves resolution between an analyte and a matrix component, but will be at the expense of Ion Current Response, hence LOD.
Humidity:
The humidity affects resolution between the analyte and the background matrix components. It can also affect whether certain peaks are detected or not. For example, in one application, a single analyte was seen as one of three separate peaks in Positive Mode, or a single peak in Negative Mode based solely upon the humidity of the sample gas-flow. However, if the humidity increased further, the analyte was not detected. A detailed humidity study of such a complicated analyte is best performed using an Owlstone OVG vapour generator coupled to an Owlstone OHG humidity generator. The combination of a known concentration of pure analyte with the capability of controlling the humidity was essential for this application. It must be stressed that such a complicated analyte is rare to encounter, however.
An alternate means of increasing the humidity through the Lonestar® system is to increase the sample temperature of an aqueous sample. This will increase the humidity, but is also likely to increase the rate of release into the headspace for background matrix components. Care must be taken when using this technique as the sample gas flow will be saturated with water vapour. If a high sample temperature is used with insufficient dilution of the sample flow with makeup flow, or if the split flow is being used, the water may condense either inside the Lonestar® or in the pipe leading to the Split Flow Box.
Salts can also be used to reduce the humidity from an aqueous sample. If the matrix is also going to have a changeable ionic strength, saturating the solution with a salt will reduce sample-to-sample variability.
Polarity:
Salts can also be used to affect the polarity within the sample. Polar analytes are liberated into the headspace more effectively if the polarity of the solution is reduced. Similarly, non-polar analytes are liberated into the headspace more effectively if the polarity of the solution is increased.
Lonestar® Total Flow Rate:
Increasing the total flow through the Lonestar® has the effect of increasing the Ion Current response by increasing the transmission through the Lonestar® chip. Increasing the flow rate will also reduce resolution between the peaks. Typical flow rates are between 2 and 3Lpm, but flow as high as 4.5Lpm have been used. It is important that, not only, your compressed air supply is able to cope with such high flows but the zero air generator and dryer have this capacity too.
Split Flow:
It is important to be aware that if the RIP is no-longer seen when a sample is analysed, either because the analyte peak or background matrix peaks are large, the system has lost the capacity to ionise any further components. Dimer peaks are likely to be formed also, whether analyte-analyte, analyte-matrix or matrix-matrix. Quantitation may be performed on either monomer or dimer peaks as required, but quantitation should not be performed when the RIP has been lost as there is no guarantee that all the analyte has been ionised, thus detected. For this reason, the ATLAS Sampling Module Assembly and Split Flow Box working in conjunction can be used to control the sample, split and makeup flows.
Timed events can be programmed into an analysis using the Split Flow Box, allowing different split flows to be used during a sample analysis. In this way, a larger dynamic range of quantitation is possible; quantitating low-concentration samples using no, or low, split flows and also quantitating high-concentration samples using a large split, both occurring during the same sample analysis.
If a chemical reaction is being monitored, it is possible to quantitate the monomer of the product peak early in the reaction and the dimer of the reagents; then later in the reaction, the dimer of the product peak and the monomer of the reagents can be monitored.
pH:
It may be worth evaluating the effect of pH upon Ion Current Response also. The analyte pKa is often available from a literature search. Similar to the effect of polarity, acidic analytes will be liberated into the headspace more effectively if the pH of the solution is lowered. Basic analytes will be liberated into the headspace more effectively if the pH of the solution is increased. Depending upon the analyte, more than one sample pH may improve the Ion Current Response for an analyte.

Figure 3 The effect of pH upon Ion Current Response and Compensation Voltage for an example analyte
The optimal pH for this analysis was determined to be pH12.5, however, the samples were typically pH2. To reliably correct the pH, a mixture of sodium hydroxide and saturated calcium hydroxide was used. Saturated calcium hydroxide buffers to pH12.5, hence samples with different pH’s could be analysed using the same sample preparation steps. Where variability in sample pH is likely, using a saturated solution in this way will buffer to a given pH depending upon the salt used.
Stirring of the Sample:
The ATLAS Sampling Module Assembly can have stirring module integrated into it on the underside of the Sample Holder. Stirring causes rippling of the surface of the sample; increasing the effective surface area of the sample. This liberates more analyte, water vapour and volatile matrix components into the headspace during a given time. Care should be taken to avoid splashing of sample up the side walls of the sample bottle or onto the dip-tube, as the latter may cause contamination between samples.
Stirring is also important is a salt is added or if the pH is being buffered to ensure sufficient mixing of the sample during its analysis.
Other Considerations
Headspace Pre-concentration:
The Split Flow Box can have timed events programmed into a developed method. In this way, the sample flow can be delayed for a pre-determined time, allowing headspace pre-concentration to occur within the sample bottle.
This is especially useful when analysing volatile analytes that are present at low concentrations within the sample.
Analysis Mode:
The Lonestar® is typically used to view the entire Dispersion Field Matrix during method development, similar to the image in Figure 1; however, custom Dispersion Field values can be used. The time for the stable detection of the analyte should be known by now. If an analyte is to be quantitated and the different background matrices are understood, the Lonestar® can be programmed to look specifically at the Dispersion Field that gave optimal resolution between the analyte and any background peaks. Where volatile analytes are being detected, it is useful to monitor the optimal Dispersion Field to view the maximum Ion Current response achieved by the analyte. Alternatively, if the sample takes a long time to equilibrate to the stable detection time, the time can be set in the Lonestar® software for the Lonestar® to begin analysing the sample at the required Dispersion Field.
In the example shown in Figure 4, the sample required 10 minutes to equilibrate and reach the stable Ion Current Response. For 10 minutes, the Lonestar® was set to monitor 0% Dispersion Field to avoid charge build-up within the system before monitoring at the desired Dispersion Field for a further minute.
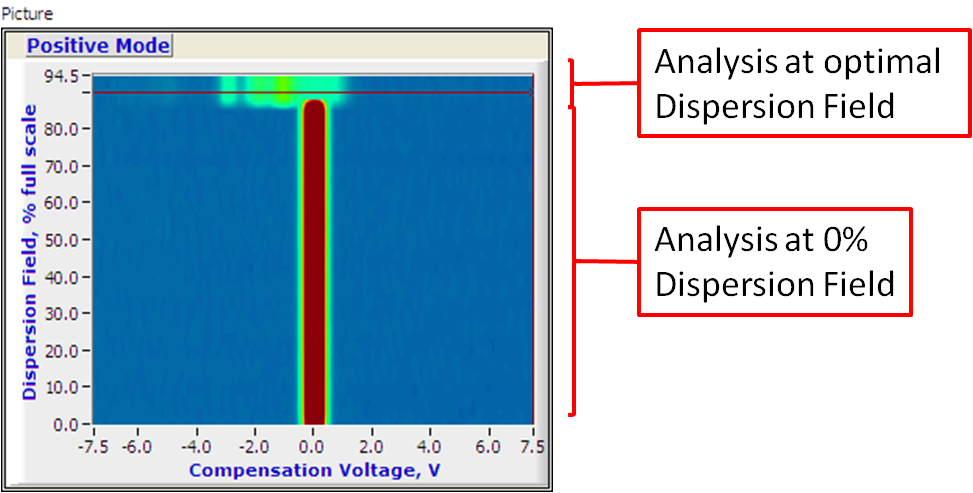
Figure 4 Dispersion Field Matrix for a caramel sample containing example analyte

Figure 5 CV Sweep showing the Ion Current Response for the example analyte at optimal Dispersion Field
Sample Averaging:
The signal-noise may be improved for an analyte by applying averaging to the detection method. In this way, each Dispersion Field is monitored multiple times and the Ion Current Responses at each step of the CV Sweep are averaged. This will, of course, increase the analysis time, but is useful if the equilibration time is significant and the stable detection time for the analyte is over a minute in duration.
Appendix 1. The Lonestar® System
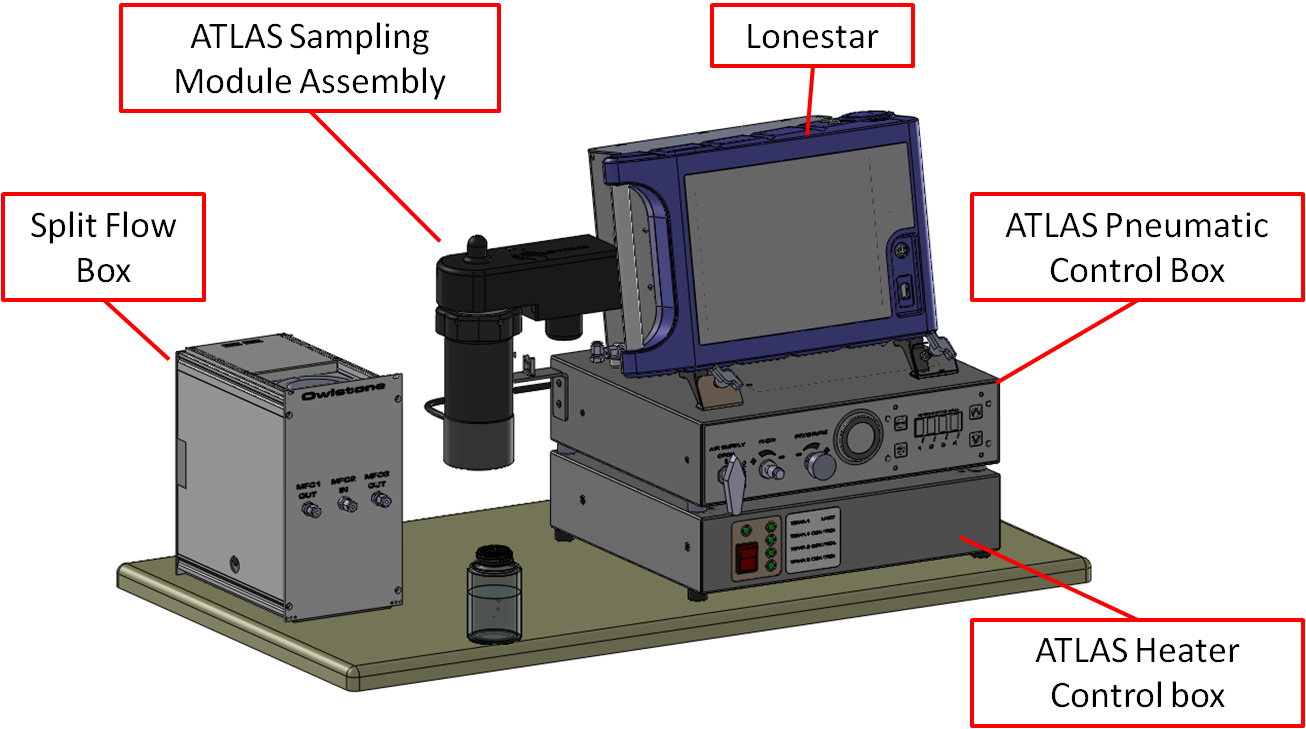
Figure 6 the Lonestar® System
Figure 6 shows the components of the typical Lonestar® system. The Split Flow Box is used to control the sample, split and makeup flows within the ATLAS Sampling Module Assembly and Lonestar®. The ATLAS Sampling Module Assembly is a temperature-controlled means of introducing the headspace of a sample into the Lonestar®. This sample flow may be diluted using a split flow before it is filtered to remove any particulates and the makeup flow is introduced. The ATLAS Pneumatic Control Box controls the pressure of the clean gas used by the Split Flow Box and also controls the pressure within the Lonestar® system. The stirrer controls are also mounted in the ATLAS Pneumatic Control Box. The ATLAS Heater Control Box controls the heated zones in the ATLAS Sampling Module Assembly, specifically the sample, lid and filter region temperatures.
If you wish to print this document, a pdf version is available by following the link below:
Comments
Please sign in to leave a comment.