Home Screen
Division of Home screen
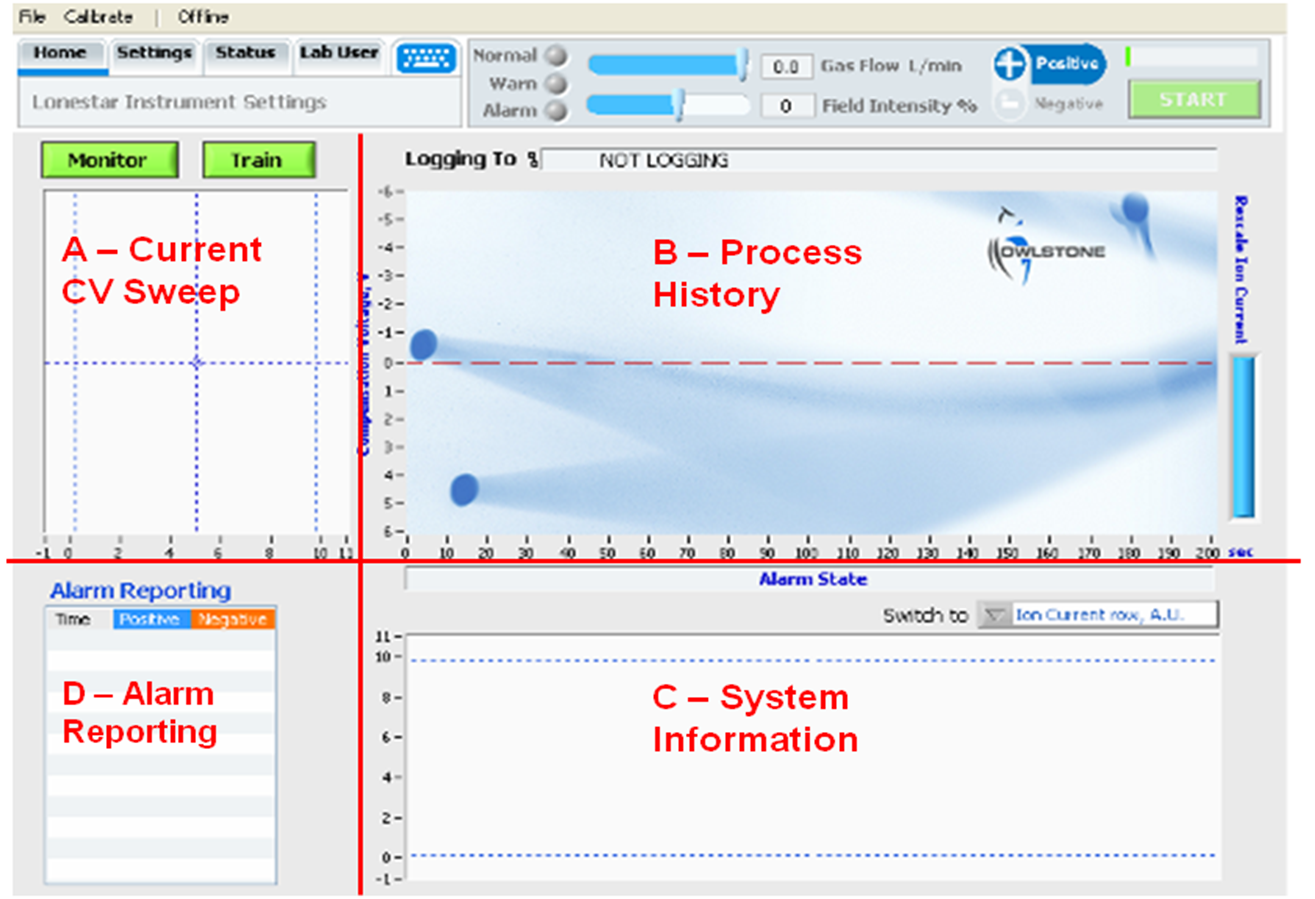
The ‘Home’ tab provides the main process monitoring functionality with the ability to analyse the gas flow at a set Field Intensity whilst Training or Monitoring for deviations from the norm. For the purposes of this chapter the content is divided into four main sections, the terminology of which is described below:
A – Current CV Sweep - 1D Spectra showing the last CV sweep. Also turn Monitoring and Training on/off
B – Process History - 2D Spectra showing history of last 200 CV sweeps
C – System Information - Quick links to specific system data over time
D – Alarm Reporting – Details of the last 12 alarms to be triggered
To begin, select the desired Gas Flow and Field Intensity and then click the ‘START’ button in the Navigation Bar.

Selecting a log file
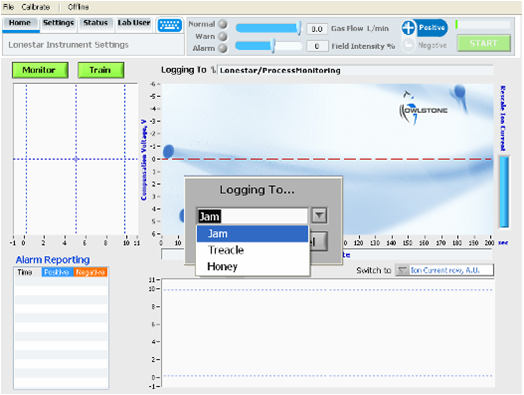
A pop up box will appear to allow selection of a filename for data storage. Either select a name from the drop down box (if available), or enter a new one. Leaving the dialogue box empty or clicking ‘Cancel’ will turn data logging off.
Note that the Lonestar system only has limited storage space. If large data files are to be generated it is recommended that these be stored directly on a network or an external hard drive. The default file path can be altered in the Settings screen.
Selecting a log file
The pump speed will ramp up to the desired set point and then the system will begin to scan.
The scan rate is indicated by the progress bar in the top right hand corner of the screen:

A- Current CV Sweep
 |
On completion of each sweep the Current CV Sweep Graph in the top left of the screen will update with the latest data set. This graph will auto-scale. There is also the ability to perform a quick-start Train as well as turning Monitoring on and off. See the section on ‘Home Page – Quick Train’ for more details
To toggle between viewing Positive and Negative Ions simply click the ‘Positive/Negative’ button in the Navigation bar. The current CV sweep will update accordingly, with the positive mode shown as a blue trace and the negative mode shown as a red trace. |
CV sweep screen
B – Process History
The top right graph (B) will provide a rolling history of the CV sweeps. As the system records data it will first over-write the splash screen and then continue to scroll.
If a log file has been selected then this will display in the ‘Logging To’ box, otherwise there will be a reminder that the data is not being saved. Note: It is not possible to turn saving on or off whilst data is being collected; the system needs to be stopped and restarted to do this.
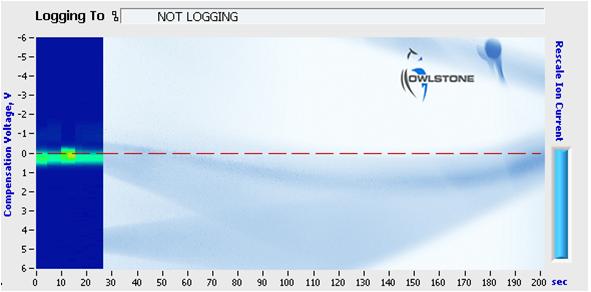 |
The y-axis can be rescaled using the ‘Rescale Ion Current’ drag bar on the right hand side. This will reveal more information about lower ion currents, but may saturate the higher signals. |
Process history screen
 |
Again to toggle between viewing Positive and Negative Ions simply click the ‘Positive/Negative’ button in the Navigation bar. The positive mode data is shown with a blue background (as in the image above) and the negative mode is shown with a red background. |
Note that the system takes time to stabilise completely. For the first 20 minutes the peak heights will vary as the temperature and humidity in the unit reaches equilibrium.
C -System Information
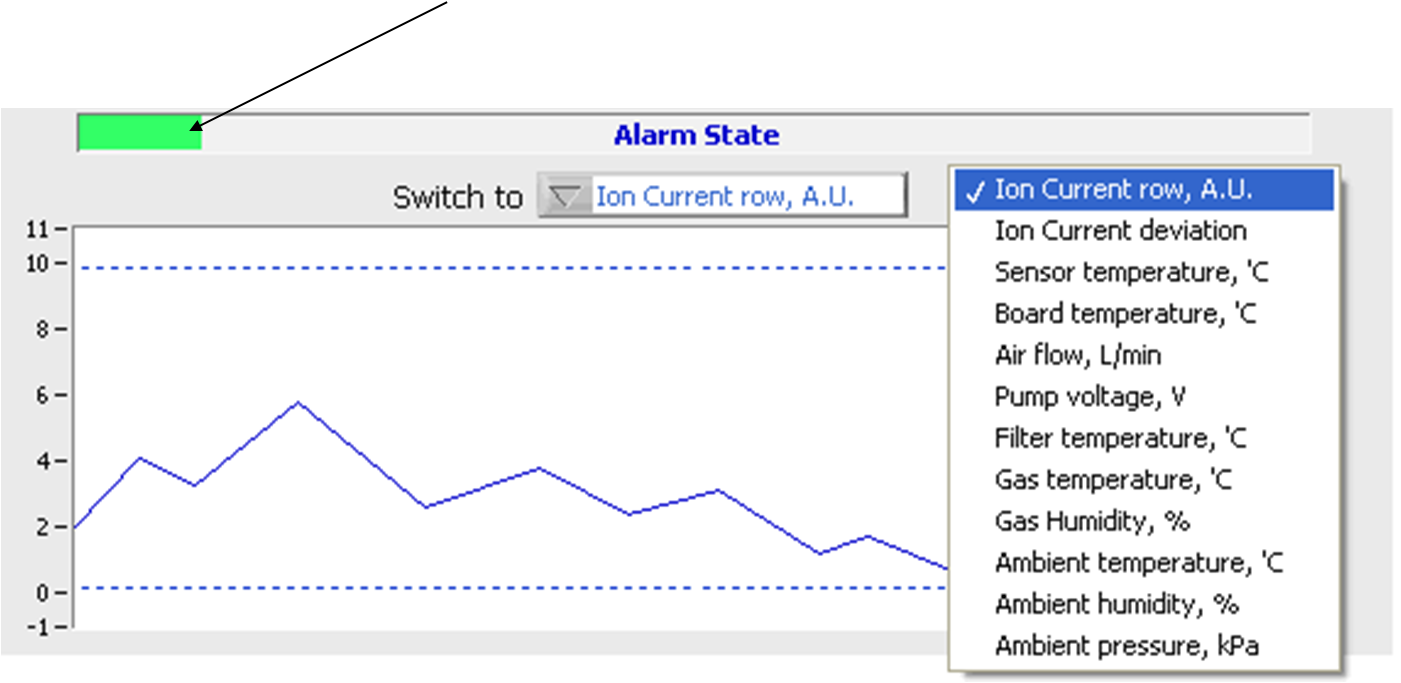
The bottom right quadrant (C) contains additional system information, plotted over time in synchronisation with the Process History Graph. A single variable can be displayed in sync at once. To select the variable, click on the ‘Switch to’ drop down box. The following options are available:
- Ion Current row, AU – Tracks the total number of ions that are detected at the position of the horizontal cursor in the Process History graph
- Ion Current Deviation, AU – Once the system has been Trained this variable will track how much the total ion current deviates from normal
- Sensor temperature, °C – Temperature of the Owlstone FAIMS chip
- Board temperature, °C – Temperature of the Owlstone control electronics
- Air flow, L/min – Measured flow rate through the FAIMS chip
- Pump voltage, V – Pump voltage required to achieve Air Flow rate
- Filter Temperature, °C – Temperature of the filter module upstream of the FAIMS chips
- Gas Temperature, °C – Temperature of the Gas Flow as it exits the FAIMS chip
- Gas Humidity, % - Relative humidity of the Gas Flow as it exits the FAIMS chip
- Ambient temperature, °C – Core temperature of the Lonestar system
- Ambient humidity, % - Relative humidity of the air inside Lonestar
- Ambient pressure, kPa – Not used in this software release
If Monitoring is on then the ‘AlarmState’ history will also update, indicating whether the system is in Green, Amber, or Red status.
Alarm state history
D – Alarm Reporting
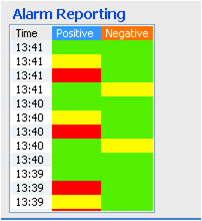 |
The Alarm reporting shows the last 12 alarm status changes. If either the Positive or Negative alarm conditions change during process monitoring this will be shown on the chart along with a time stamp to the nearest minute. The colour coding corresponds to Green, Amber or Red alarms. Note that Alarm Reporting is only active if the ‘Monitor’ button is active and the system has been trained properly. |
Comments
Please sign in to leave a comment.